
Why Maintenance Performance, Reporting, and KPIs are Critical to Organizational Success
If you want to achieve any objectives in life – whether personal, group, or organizational – then you have to know where you are going. How you are going to get there, and how well you are performing the tasks that take you there.
This is just as applicable to maintenance as it is to life.
KEY TAKEAWAYS
- Maintenance analytics - in the form of KPIs - help to measure and drive maintenance performance to optimal levels.
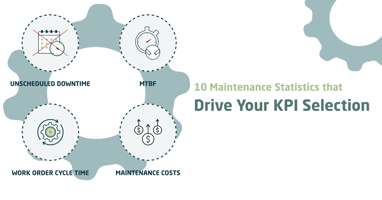
- There is a vast selection of potential metrics to choose from, for example, costs, delivery, resources, quality, reliability, risk, and many others.
- While leading KPIs provide a perspective on future performance, lagging KPIs are result-type metrics.
- There are five standard maintenance performance KPIs: unscheduled downtime, reactive maintenance work hours, maintenance costs, mean time between failure, and work order cycle time.
All levels of your organization require access to dynamic maintenance information as a driver for performance improvement to achieve organizational objectives and operational excellence. Maintenance performance can be digitally analyzed through key performance indicators (KPI), much like the indicators and gauges on your automotive dashboard. They give you an immediate sense of direction, performance, and perspective.
In the modern drive towards industry 4.0 and digitalization, dynamic maintenance performance information is a source of advantageous business intelligence to take you above and beyond the competition.
It is your responsibility to take advantage of that maintenance performance business intelligence to stay ahead of the game.
Measure Maintenance Performance Indicators
Modern and forward-thinking enterprises treat maintenance as a profit center rather than a cost center. If you can fine-tune maintenance performance, then you can improve organizational performance, and lower costs and business risks at the same time. They are the fundamentals of modern asset management.
Maintenance analytics - in the form of KPIs - will help you measure and drive your maintenance performance to optimal levels. They can help you chart a new and profitable course by providing a clear line of sight between maintenance tasks and overall organizational objectives.
|
Ultimately, metrics will help tell the organization where it has been, where it is heading, whether something is going wrong, and when the organization reaches its target. SMRP Best Practices 5th Edition |
If you consider industrial maintenance to be a process, then there are a multitude of inputs and outputs. There is a vast selection of potential metrics to choose from. You can measure maintenance costs, delivery, resources, quality, reliability, risk, and many others. Your concern must be the effectiveness and efficiency of the people, tools, and processes in terms of maintenance performance. How quickly are work orders or service requests being turned around? What is the ratio of Preventive Maintenance to reactive maintenance? How much downtime does your asset base have?
Be selective when it comes to measuring maintenance performance.
You do not want to overwhelm people with information. Utilize your EAM or CMMS software (What is EAM?) to convert raw data into usable information on digital dashboards that help maintenance managers and CEOs analyze, plan ahead, and make corrective action to business strategies.
So, what about the number of KPIs that you should have on your EAM / CMMS dashboards?
Firstly, too few and you risk missing opportunities. Too many and people get confused. Think of the difference between an automotive dashboard and an airliner’s dashboard. Somewhere in between those will be the optimum number of KPIs for your organization relevant to its size, asset base, and risk profile.
|
Metrics should encourage the right behavior, should be difficult to manipulate and easily reported. Maintenance & Reliability Best Practices, Ramesh Gulati. |
Did you know that KPIs can also be leading or lagging?
What are leading or lagging KPIs?
Leading KPIs are those that give you a perspective on future performance. Take the PM Compliance (%) metric, for example. If this is high, then it follows that reactive maintenance and downtime will decrease in the future. Conversely, low compliance would suggest increased risks of asset failure soon. On the other hand, lagging indicators are like looking in the rear-view mirror, i.e., the past. They are usually results-type metrics.
A good example is maintenance costs. This is because the cost comes at the end of the maintenance process. All organizations must have the right balance of both leading and lagging maintenance metrics.

5 Maintenance Key Performance Indicators
Only you and your maintenance organization can determine which specific asset management KPIs fit your organization correctly and align with the organizational plan. But, let us look at five standard maintenance performance KPIs. We will look at five of them in detail with a couple of maintenance kpi formulas.
1. Unscheduled Downtime
Unscheduled downtime is painful for asset-intensive organizations.
According to Vanson Bourne, average industrial downtime costs are 250.000 USD per hour, according to field service and IT decision-makers. Furthermore, 70% of the companies lack awareness of which assets require maintenance. This leads to unexpected failures and expensive downtime. Having an optimized maintenance strategy in place can reduce downtime by more than 30%.
Unscheduled downtime KPIs help maintenance managers analyze how successfully they have implemented maintenance strategies. But how do we calculate unplanned downtime?
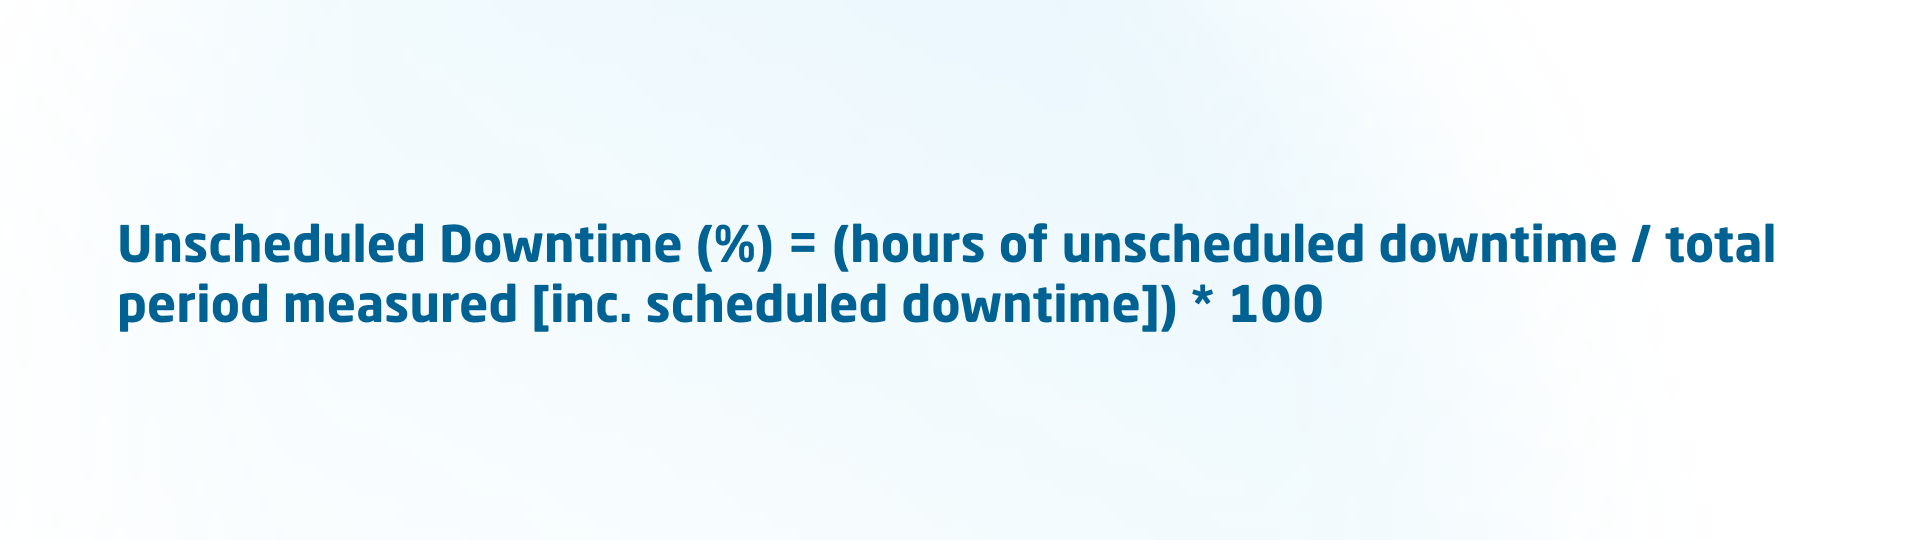
And just as important here is to understand how downtime affects your costs! There is a straightforward calculation to measure it:
Think in 1-hour time frames. Consider how many parts are produced every hour. Then think about how much profit is made on each part. Using this formula, if you make a profit of $30.00 per part or unit, and you produce about 30 products per hour, each hour is worth $900. If an asset failure causes you 3 hours of downtime, you lose $2,700.00 in just those few hours!
2. Reactive Maintenance Work Hours
Reactive maintenance - often referred to as breakdown maintenance - means that equipment repairs are performed after the equipment failure. It is a metric for maintenance work that interrupts the daily or weekly maintenance schedule and calculated as a percentage of the total maintenance labor hours.
You may think that reactive maintenance makes sense. Why not repair things only when they break? But it has been proven that it costs a business much more in the long run. Unscheduled downtime losses can lead to late deliveries, lost customers, high production costs, and revenue losses.
When you can plan all your maintenance activities, you will have stable, predictable costs. And you will be in control of your assets and production runs. Not the other way around. In the reactive approach, failures occur unexpectedly, and technicians waste vital time in panic mode looking for manuals, spare parts, and special tools. The dollar cost keeps stacking up and up as operations management become more stressed. There are no winners in this situation.
Here’s how the reactive work KPI is calculated (SMRP Best Practices 5th Edition):
For this KPI, you should focus on lowering the % of reactive maintenance work orders as much as possible. But be realistic. If you do not carry out preventive maintenance, then setting a goal of zero reactive work orders in a month will only bring disappointment!
|
Metrics are used to drive improvements and help businesses focus their people and resources on what is important. SMRP Best Practices 5th Ed |
3. Maintenance Costs
Now, this metric is common in most industries. You have probably already seen it in your organization. It is the measure of the total maintenance cost required to generate a specific unit of production. Steelmakers are concerned with costs per tonne of steel, brewers per keg of beer, and carmakers per car. Simple right? Typically the maintenance costs per standard unit of production are measured over a specific period, i.e., monthly, quarterly, or annually. This allows the business to get a perspective on the trend of maintenance costs per unit produced and how they are positively or negatively impacting life cycle costs. The maintenance costs metric is flexible and can be applied to one asset, a collection of assets, or a plant as a whole – even multiple plants under an organizational umbrella. The simple KPI formula is:
As an example, let’s say we are manufacturing hand sanitizer by the liter. Last month we turned out a million liters of the product for shipment. Our month’s maintenance costs were $100,000. So here’s the calculation:
Maintenance Unit Cost = Total Maintenance Costs / Standard Units Produced
Maintenance Unit Cost = $100,000 / 1,000,000
Maintenance Unit Cost = $0.10 per liter
Simple, right?
Absolutely!
If you can trend this figure on a weekly or even monthly basis, then it will give you an excellent platform for maintenance cost improvement. Or if your facility is already great, then pat yourself on the back right now.
Now let’s get back to that word we all fear on the shop floor: failure!

4. Mean Time Between Failure (MTBF)
Simply put, failure is when an asset or equipment is unable to perform its required primary function. Just when you need it, it cannot do the function you bought it for. This is not good for business. Whether your asset is producing tonnes of steel or warming up your coffee in the morning, both can be critical to you, and you cannot have them fail!
The mean time between failures metric is the average operating time between failures. MTBF is a well-known basic measure of the reliability of an asset or component. It is used to assess the reliability of a repairable asset. When we say repairable, we mean those assets or components that can be repaired when they fail, i.e., pumps, valves, and conveyors. Non-repairable items use a different metric called mean time to failure (MTTF). They are items such as light bulbs, electronic items, or circuit breakers, i.e., when they fail, they are simply swapped out.
When you trend MTBF, then an increase in the metric is a good thing and will signify that the asset reliability in improving or increasing. It’s a simple KPI formula:
Let’s say you are a mining company, and you’re monitoring the MTBFs of each haul truck. One troublesome vehicle has had a running time of 3,500 hours this year and already suffered nine failures. What is the MTBF?
MTBF = 3500 / 9
MTBF = 389 hours
This is converting simple data into information: a great starting point for asset reliability improvement.
That’s several maintenance metrics looking at maintenance downtime, costs, and failures. Now let us have a look at a common work management metric.
Read more in detail about MTBF and Failure Data Analysis here.
5. Work Order Cycle Time
The work management process’s performance is a key area where operational and maintenance costs can be optimized and risk lowered. The work order cycle time KPI is the time from the initialization of a work order until it is technically closed in the EAM or CMMS. The objective is to understand how long it takes to complete work, from creation to completion. If your average trend is increasing, then you’ll have good reason to investigate the root causes. Maybe you have delays in spare parts ordering, resource issues, planning problems, or unexpected spare part lead times.
It’s a simple calculation:
*The Work Order Creation Date is when it was entered into the EAM or CMMS.
**The Work Order Completion Date is when it was technically closed and includes further data such as work done, hours worked, parts used, planner feedback, and more.
But if we are measuring KPIs, then it must be because we have an overall objective, right?
The 5 SMART Objectives
It is always beneficial to use SMART goals when it comes to maintenance!
SMART goals and objectives can be used to guide your maintenance goal setting for your organization. You are providing a target to aim for as well as reflecting on your performance and achievements.
But you may now be asking ‘what is SMART’?
Specific: Every goal should be well defined, clear, and unambiguous.
Measurable: the objective must have criteria that measure your progress towards the accomplishment of the goal. Each objective has different standards for evaluating progress against the goal.
Achievable: Attainable and not too difficult to achieve. You don’t want to alienate people.
Relevant: Pertinent to your organization’s overall purpose and business or operations plan. It can be achieved within the time set and with the resources available.
Timely: With a clearly defined timeline, including a starting date and a target date. This will create a sense of urgency and motivation.
Here are some examples of SMART maintenance goals:
- Reduce unplanned downtime by 50% by the end of 2021.
- Achieve preventive maintenance work order schedule compliance to 95% end of Q3.
- Reduce work order cycle time by 15% over the next six months.
Writing SMART goals will help you question your maintenance processes.
This can only be a good thing. And your findings will help to fine-tune your strategy so that the goals can be achieved.
But how do stakeholders get the information? And quickly?
Maintenance Reporting Matters
As we now know, maintenance performance data converted to information is business intelligence. It’s a competitive advantage. But what good is that intelligence if it is sitting idle on a database or a server? Maintenance stakeholders, decision-makers, and key people of influence need digital dashboards and reports to get a rapid overview of maintenance performance and KPIs.
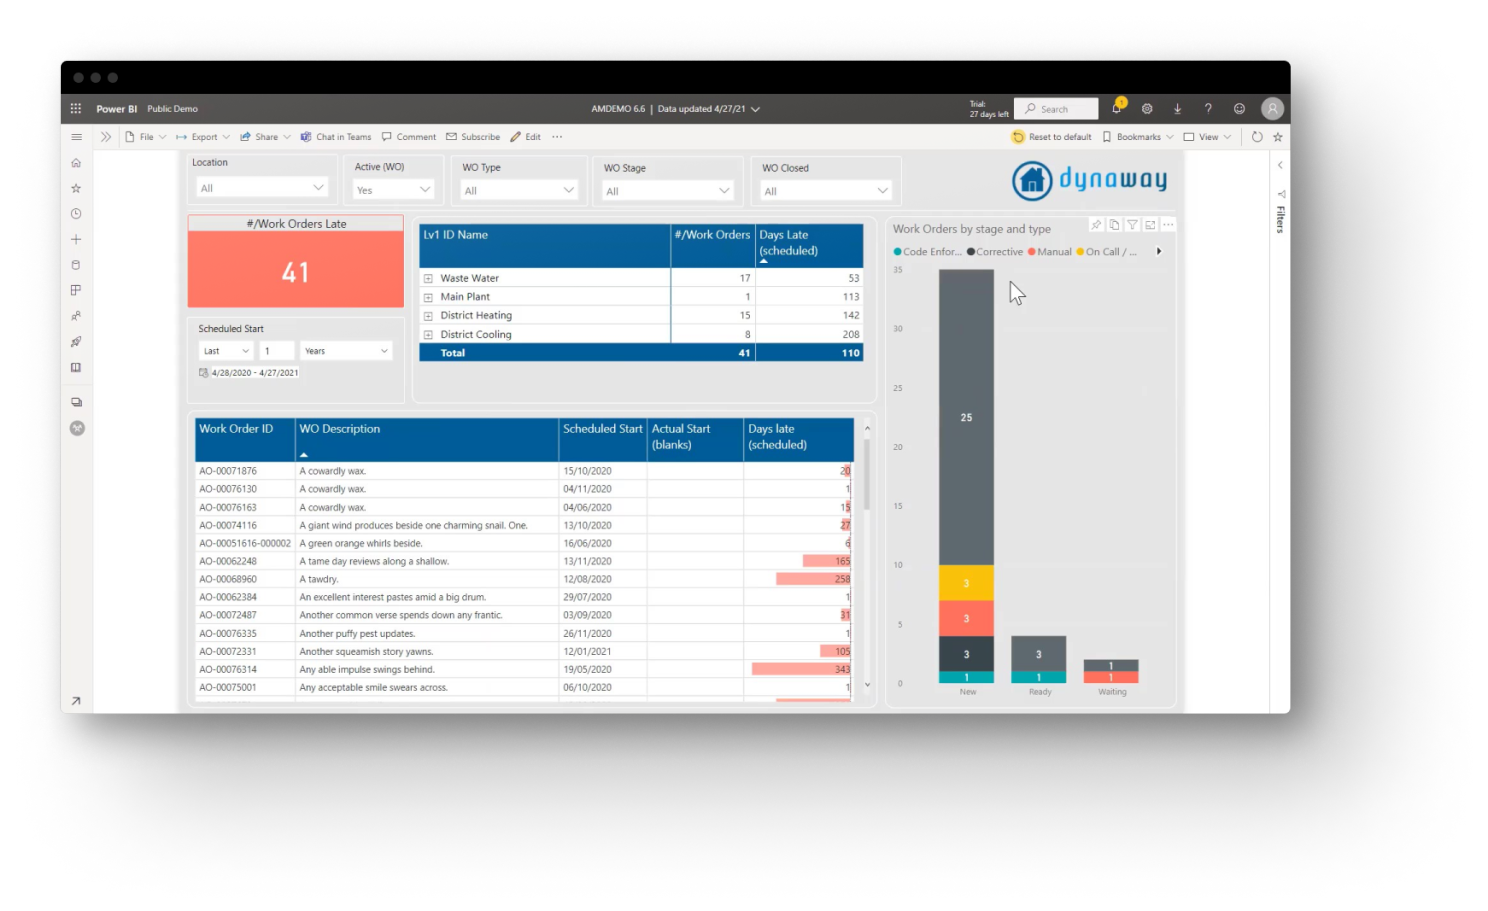
Maintenance decisions must be data-driven to be effective. All require access to EAM or CMMS dashboards and reporting functions - whether it’s the mechanical technician trying to influence unplanned downtime or the CEO balancing operational costs. They can influence KPIs, but they have to easily see trends and performance changes at the touch of a button. And this is where a modern, analytical and digital EAM software is worth its weight in gold!