
Industrial maintenance is awash with data.
It can be from automated sources like sensors, monitors, trackers, and recorders, or from manual input by technicians and engineers into EAM or CMMS. It even includes spreadsheets, documents, manuals, policies, and procedures.
The key is converting the data into usable information for decision-making and business intelligence.
Get ahead by leveraging the information for competitive advantage and delivering the asset management value from your critical assets. One easy way to facilitate this is to have a suite of KPIs.
KEY TAKEAWAYS
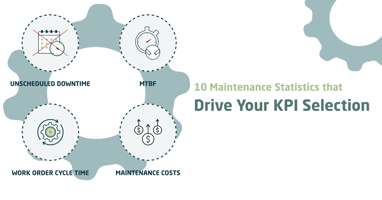
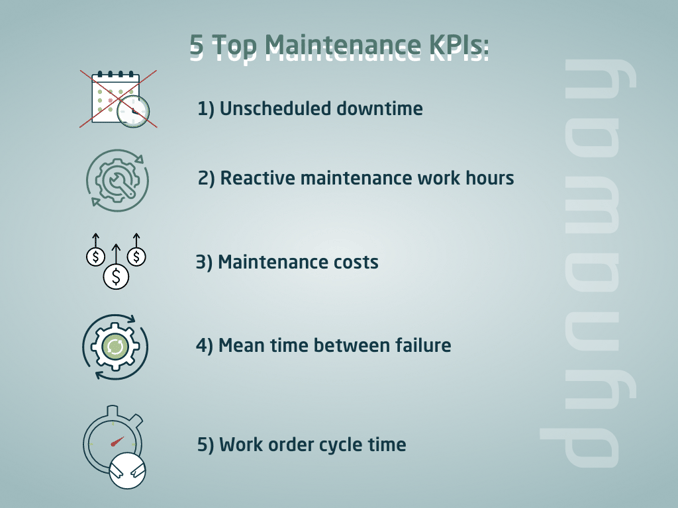
- The most common maintenance performance indicators are unscheduled downtime, reactive maintenance work hours, maintenance costs, mean time between failure (MTBF), and work order cycle time.
- The statistics emphasize the necessity of measuring maintenance performance through KPIs to make informed decisions, optimize operations, and maintain a competitive edge in the business landscape.
Key Performance Indicators
All the best-in-class companies use KPIs to understand the direction of the business – for good or for worse - and to facilitate optimum decision-making.
Maintenance departments are no different.
Five of the most common KPIs or maintenance performance indicators are: unscheduled downtime, reactive maintenance work hours, maintenance costs, mean time between failure (MTBF), and work order cycle time.
So, now you can see why measuring maintenance performance is crucial.
But why take our word for it?
Maintenance Statistics
Let’s look at some maintenance statistics from industrial surveys.
This is a good place to start to see the link between maintenance management performance and metrics and collecting the right data for information.
Here are ten maintenance statistics that link well with five of our key KPIs:
KPI = Work Order Cycle Time
1. Almost 37% of maintenance managers say their biggest challenge is getting people to use the CMMS properly (Add Energy 2022).
This is a big problem in most industrial settings. It may be a cultural issue, it may be a training issue, or it may be that the software is just not fit for purpose.
People vote with their fingers and refuse to use the keyboard. Senior management must prioritize the use of the CMMS or EAM as it is vital to maintenance excellence and success. One indicator of poor usage is excessive work order cycle times: watch out for PMs not being performed, work requests not being converted into work orders (WOs), and work orders being left open or not closed out in a reasonable time.
On the other hand, if your KPI trend is increasing, you may also have delays in ordering spare parts, resource issues, planning problems, or unexpected spare part lead times.
KPI = Maintenance Costs
2. 53% of companies spend more than 30 hours a week on maintenance (Plant Engineering 2021).
3. 34.7% of maintenance managers say the biggest challenge is budget/resources (Add Energy 2022).
4. 37.2% of maintenance managers say budget restraints have become more challenging over the last 5 years (Add Energy 2022).
These statistics show that many managers are very concerned with their maintenance budgets and spending. This increased pressure can lead to short-termism and the risks that come with cutting corners on maintenance.
Most companies surveyed spend at least 30 hours a week on maintenance, which comes at a cost.
The statistics show that monitoring maintenance costs is crucial to stay on top of your budget and in control of risks. This KPI allows the business to get a perspective on the trend of maintenance costs per unit produced and how they positively or negatively impact life cycle costs.
It’s simple and effective; use it.
KPI = Reactive Maintenance Work Hours
5. 88% of companies have a PM program in place (Plant Engineering 2021).
6. 39.9% of maintenance managers say equipment reliability is their biggest challenge (Add Energy 2022).
This shows that it is vital for maintenance departments to monitor reactive work hours. Having PM programs in place reduces the likelihood of asset breakdowns – assuming they are worthwhile and value-adding programs. Almost 40% of surveyed managers also say equipment reliability is their biggest challenge: reactive losses can lead to late deliveries, lost customers, high production costs, and revenue losses.
Poor reliability (chronic and acute) causes reactive maintenance, so monitor it and get to root causes and solutions when breakdown occurrences become unacceptable.
KPI = Unscheduled Down Time
7. Only 24% of companies surveyed use an RCM strategy (Plant Engineering 2021).
8. 54% of maintenance managers say uptime is the most important measure (Add Energy 2022).
It is concerning - and no wonder - that companies struggle with downtime when so few use RCM or a similar philosophy to develop or optimize their maintenance strategy.
Unscheduled downtime can come from breakdowns, repair delays, overruns on scheduled maintenance, and other sources.
Measure your plant’s unscheduled downtime. More than half of maintenance managers say it’s their most important metric. This KPI helps maintenance managers analyze how successfully their maintenance strategy is performing.
KPI = Mean Time Between Failure (MTBF)
9. 67% of companies believe aging equipment is their key challenge for improving maintenance (Plant Engineering 2021).
10. 57.5% of maintenance managers selected reliability as an important KPI (Add Energy 2022).
Although a very simplified reliability metric, MTBF is the average operating time between failures and can be used as a basic guideline for plant, asset, or component reliability.
Most companies believe that aging equipment is the key challenge. And it is a valid point: as assets get older the fits and tolerances open up, more and more components get to the end of useful life, and maintenance costs will increase.
Just like running your old car (if you have one).
This is why most maintenance managers use MTBF as an important KPI.
You certainly should too.
A Measured Perspective
The statistics above have shown that maintenance really needs to be measured.
Maintenance data converted to information is real, solid business intelligence. Maintenance decision-makers and stakeholders need a rapid overview of maintenance performance and KPIs to gain a competitive advantage and change course quickly when required.
It’s really quite simple: maintenance decisions must be data-driven to be effective.