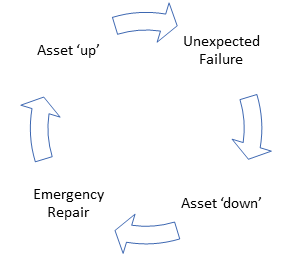
For organizations that suffer from unexpected failures and unplanned downtime, Failure Modes and Effects Analysis (FMEA) can help achieve high asset reliability and availability.
You get reliability and availability right, and you are a long way down the road to profitability.
But here’s a surprise.
Many organizations and manufacturers never make this journey and happily continue (if useable product is getting to the customer on time) in a downward spiral.
‘But that journey you talk of is RCM!’ they cry. ‘Way too expensive for us!’
The same manufacturers always seem to have time (and money) to scrap wasted product, purchase new bearings, clean oil spills, fix machines, call in OEMs (Original Equipment Manufacturer), and keep people working overtime. And once a year – with much fanfare and ceremony - they present an award to reactive maintenance ‘heroes’.
Hmmm.
You are thinking: ‘People get their picture in the company newsletter, a handshake from the VP for keeping the plant in reactive maintenance?’.
Yes, they do. But let’s move beyond that.
Getting to good asset reliability and high availability doesn’t need a full RCM study. But it does require a good FMEA (Failure Mode & Effect Analysis) with good outputs, and the application of P-F (Potential Failure to Functional failure) curves to ensure condition monitoring techniques are focused on the right failure modes at the right frequency of inspection.
Failure Modes & Effects Analysis: getting to the bottom (or top) of things
An FMEA is a common analysis tool that helps designers, technicians, and engineers understand how a critical asset or component can fail, the effect it has on the overall system, and what they can do to mitigate the effects.
The essence of an FMEA is understanding the failure modes, how likely they are to occur, and mitigating them with specific maintenance actions, redesigns, or even ‘do nothing’ (if the risk is low enough).
FMEAs come in two basics types.
Bottom up – this FMEA starts with listing every component in an asset and listing all the possible ways it can fail. It is often known as the ‘hardware approach’. This type of FMEA is more laborious but is often used in high safety and environmental consequence sectors such aviation and nuclear.
Unexpected asset failures cannot be tolerated in these sectors.
Top down – this type of FMEA (also known as the ‘functional approach’) is more common and – yes, you’ve guessed it – considers the functions of the asset first. When functions are known, we ask ‘how can it functionally fail?’ This the leads us to failure modes and the search for effects and mitigating actions.
A top down FMEA directly addresses only the most important contributors to potential problems rather than every individual component.
There are also FMECAs (C for criticality) which add in a numerical risk factor.
Have a look at this example which encompasses an FMEA and an FMECA.
We’ll keep it simple and consider the windscreen wipers on a car. We are assuming we don’t do any checks initially and we just let them fail as we are driving along.
|
Function |
Functional Failure |
Failure Mode |
Potential Impact |
Severity |
Potential Causes |
Occurrence |
Detection Mode |
Detection |
RPN |
|
What is the function of the asset or component? |
How does it fail to fufill its function? |
What can cause a functional failure? |
What is the impact? i.e. the effects |
How severe is the effect? |
What causes the failure mode? |
How frequently is this likely to occur? |
What are the existing controls for prevention or detection? |
How easy is it to detect using current methods? |
Risk priority number = Sev x Occ x Det. |
|
To clear rain and mist from the front windscreen (on demand). |
Fails to start. |
Blown fuse. |
Car cannot clear windscreen in heavy rain. |
10 |
Debris blocking the wipers (causes overcurrent & blown fuse) |
2 |
Find on failure (whilst driving) |
7 |
140 |
|
Recommended Actions |
Responsibility |
Target Date |
Action Taken |
SEV |
OCC |
DET |
RPN |
|
How do we reduce the occurrence of the cause or improving the detection? |
Who is responsible for the action? |
What is the target date for the action? |
Recalculate the RPN to see if the action has reduced the risk. |
|
|
|
New RPN after actions. |
|
1. Inspect the windscreen wipers for obstructions before every journey. 2. Carry replacement fuse. |
Car owner |
With immediate effect |
Checklist carried in car as a reminder. And replacement fuses. |
10 |
2 |
2 |
40 |
As you can see, after implementing actions, then your Risk Priority Number should reduce.
Once you carry out an FMEA or FMECA on your plant, then you have a maintenance strategy.
Maintenance strategy: it helps you maintain inherent reliability.
So the key output of an FMEA is a maintenance strategy, principally in terms of what you need to do. This may be time-based replacements, condition monitoring, redesigns of equipment, failure-finding tasks, inspections, or overhauls, among others.
To further refine - and later implement - your maintenance strategy, you will need to decide who is going to do the work, when, and what spares will be required.
Here’s the thing to remember:
By doing the right maintenance at the right time, you can maintain the inherent reliability of the asset at a high level. Correct and proper maintenance alone can never improve the inherent reliability beyond its initial capability - because it’s an in-built characteristic.
But a good maintenance strategy can keep inherent reliability high where it belongs.
Condition Monitoring & Condition-based Maintenance: availability is King.
Let’s concentrate on condition monitoring (also known as Predictive Maintenance) tactics for a moment. This is worthwhile because their sensors, data, and information allow us to understand the asset’s health. They are the driving force behind the industrial internet of things (IIoT) and industry 4.0.
If we understand asset health at any moment in time, then we can perform that most cost effective of all maintenance – condition-based maintenance (CBM).
Here’s the thing to remember:
Condition-based Maintenance does not and will not improve asset reliability, inherent or otherwise. The thing it will give you and which is just as important to your organizational objectives is asset availability. By reducing unplanned downtime alone, you increase availability.
CBM is performing a repair or replacement task based solely on the measured health of an asset. It gives us an early warning signal of potential or impending asset or component failure.
But if we use condition monitoring techniques, how often should we measure data?
P-F Curve and Intervals
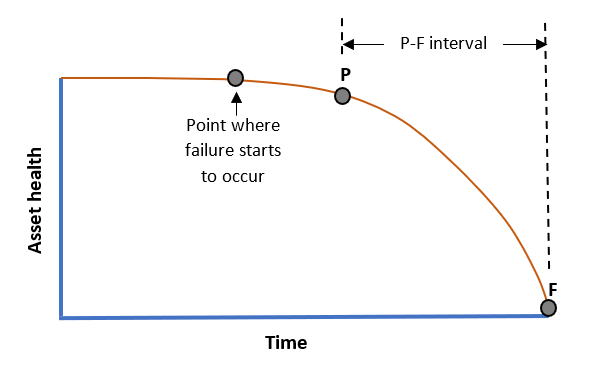
Firstly, what is this P-F curve we talk of? It is a curve that indicates how the health of an asset deteriorates over time once a failure mode is set in motion.
The diagram here illustrates the concept.
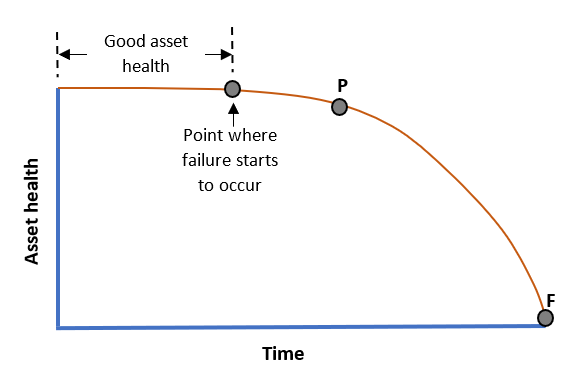
The horizontal portion of the curve is good asset health. This portion can be lengthened by maintenance best practices in:
- Asset installation
- Foundations and supporting structures
- Asset Lubrication
- Asset Alignment and balancing
- Proper operation within the asset’s capability
But then, when a failure mode presents itself, we have a point where failure has started. But it is still invisible during data collection.
Then time (or asset stress cycles) moves on to point P.
The point P means Potential Failure. This is where our condition monitoring techniques can start to detect a potential failure. Then the asset health will gradually (or rapidly) degrade until it gets to point F, the Functional Failure.
That means good night and goodbye for your asset.
The game is up and you need to call out the reactive maintenance ‘heroes’ .
The time difference between P and F is known as the P-F interval. It may be seconds to decades. It all depends on the failure mode and the asset in question.
You will do well to remember that the P-F interval for a specific failure mode is always an average number – these things will always have statistical variation.
But if we have a good idea of what it is – from past failures, RCAs (Root Cause Analysis), OEM data, etc. – then we can set the interval at which we perform condition monitoring inspections. A good rule of thumb for an inspection interval is usually at least half the expected P-F interval.
Imagine that you know when your critical pump drive end bearing vibrates at 8 mm/s it likely has only 3 months of service left before it seizes up. As a minimum, how often should you measure the vibration?
Inspection/measurement interval 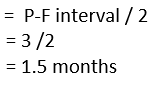
This ensures you will capture that particular defect within the expected P-F interval (though most strategists here would conservatively and generically recommend inspection intervals of 1 month – remember the statistical variation?).
It’s widely accepted that different condition monitoring techniques can provide differing levels of early warning during the P-F interval. Have a look at the diagram below for a rough guide. No-one technique is a catch all for all failure modes.
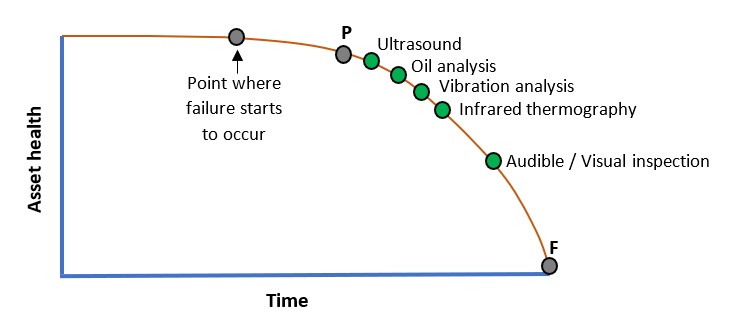
The best strategies utilize a combination of condition monitoring technologies.
The journey towards prescriptive maintenance
As a final note, considering the IIoT and industry 4.0 progress, we should consider the journey towards prescriptive maintenance.
|
Prescriptive maintenance (Rx) is unique in that instead of just predicting impending failure, as predictive maintenance (PdM) does, it strives to produce outcome-focused recommendations for operations and maintenance from the Rx analytics. Though RxM is still in its infancy, many thought leaders are considering its potential to become the next level of reliability and maintenance best practice.
|
‘But what is that?’ we hear you ask.
So, the next frontier beyond predictive maintenance will be prescriptive maintenance.
Can you imagine that?
Sensors, networks, algorithms, machine learning and AI combining to inform your maintenance team what they need to do and when they need do it to maintain reliability and increase availability. Or even how to manage the asset (speeds and loads) to extend remaining useful life once a potential failure is detected.
Maintenance strategies of the future will be fluid, changeable, and intelligently informed by technology and human-built FMEAs, P-F intervals, and OEM troubleshooting guides.
We are not there yet, but it is coming...
.png?width=388&height=200&name=Copy%20of%20Blog%20Featured%20Image%20(4).png)
.png?width=388&height=200&name=Copy%20of%20Blog%20Feature%20Image%20(6).png)
.png?width=388&height=200&name=Copy%20of%20Blog%20Feature%20Image%20(4).png)