In any asset-intensive industry, from manufacturing to mining to food and beverage processing, reactive maintenance can wreak havoc on operational efficiency, profit margins, and sustainable competitiveness. Conversely, preventative maintenance can yield significant financial and organizational benefits. In fact, studies have shown that businesses across all sectors of industry can reduce equipment maintenance costs by 12 to 18% by investing in preventative maintenance and tracking failure rates.

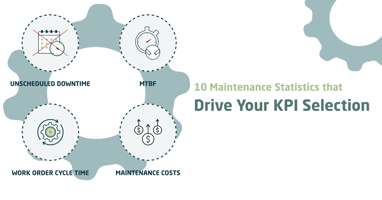
A big part of implementing a successful preventative maintenance program in your business is understanding maintenance failure data, and effectively using them as KPI's. This article will discuss 5 key metrics & failure data collection procedures that you need to consider, how to calculate them, and what benefits they offer for cost reduction and optimized efficiency.
Mean Time To Repair (MTTR)
MTTR Mean Time To Repair is a measure of the average time that elapses between the discovery of equipment breakdown and the equipment's return to operational status. This includes the time it takes to troubleshoot the issue, the time spent in actual repairs, and the time spent in testing before the machine or piece of equipment is utilized again.
MTTR can be calculated by using the following formula: total maintenance time / total number of repairs. For example, say that you want to calculate the MTTR for an evaporator in a distillery over a period of 1 week. During that span, the evaporator fails 3 times, and the total time spent in repairs equals 2 hours. In that case, 2 hours divided by 3 instances of repair would yield a MTTR of 40 minutes.
Why is MTTR a metric well-suited for use as a KPI? It can be an invaluable aid to maintenance managers in the decision making process regarding:
- The repair vs. replace question
- Necessary inventory levels of replacement parts and tools
- Staffing levels
For instance, the older a piece of equipment gets the greater its MTTR will become. After reaching a certain threshold, the maintenance manager may decide that replacement would be the most cost-effective option in the long run.
(MTBF) Mean Time Between Failure
MTBF Mean Time Between Failure gives an indication not only of the availability for each piece of operational equipment, but also the level of reliability. MTBF measures the average elapsed time between equipment breakdowns.
Supervisors can calculate MTBF by taking the total operational time of the machine in question and dividing that figure by the number of failures within that time frame.
Let's return to our example of the evaporator in the distillery. If the evaporator runs 8 hours a day for a 5-day workweek, and has to be repaired a total of 3 times within that span, then the evaporator's MTBF would be 40/3, or 13 hours and 20 minutes.
Why is MTBF a valuable metric? While MTBF is not directly related to planned maintenance, it is extremely helpful for determining the optimal frequency for certain tasks, such as equipment inspections, lubrication, etc.
In Dynaway Enterprise Asset Management, you can calculate various Key Performance
Indicators (KPIs) for Assets (objects) and object types. KPIs are used to get an overview of
performance on objects. Download EAM White Paper to learn more:
Mean Time to Failure (MTTF)
Mean Time To Failure at first glance may seem almost identical to MTBF. However, there is a key differentiation between these two metrics: MTBF always deals with reparable equipment, whereas MTTF focuses on non-reparable items. In effect, MTTF is a measure of the expected length of time a particular machine or piece of equipment will stay operational.
MTTF must be calculated as an average of multiple non-reparable units. So the formula for MTTF would be as follows: total operational time / total number of units. For example, 5 filters for a production line may need to be replaced at different times. If we take the following measurements of operational time for each unit:
- 5 hours
- 8 hours
- 11 hours
- 9 hours
- 12 hours
...and divide them by 5 (the total number of units), we would receive a MTTF of 9 hours.
How is MTTF useful? Effective maintenance and using durable, high quality components in pieces of production equipment can boost MTTF. It can give maintenance managers and plant supervisors a good idea of how long components will last, which in turn can help them to plan for downtime, keep a sufficient number of replacement parts on hand, and analyze the pros and cons of sourcing the components in question from a different supplier.
Planned maintenance percentage (PPC)
Planned maintenance percentage gives a proportion of time spent on planned maintenance compared with total maintenance time. The formula for PPC is relatively straightforward: (planned maintenance time/total maintenance time) x 100.
Generally speaking, 90% PPC is a good number for which to aim. If PPC numbers are sub-optimal, however, a detailed analysis of which systems are suffering the majority of unexpected failures can help managers prioritize areas of need, and implement strategies to mitigate the effect of unplanned downtime.
While PPC may be a broad metric, it can give you a solid indication of how effective your current preventative maintenance program actually is.
Planned maintenance compliance (PMC)
Planned maintenance compliance is a measure of how well your maintenance department is performing their required tasks. While PMC may not tell you if work orders are being completed on-time, it can give you a percentage of completed work orders compared to total work orders requisitioned.
The formula for PMC is, again, very straightforward: (completed work orders/total work orders) x 100. For instance, if 100 work orders are submitted within the month of June, and 78 are completed by month's end, then your PMC for June would be 78%.
PMC is helpful as a KPI for your maintenance staff's performance, and can also help you to determine if staffing levels should be adjusted, or additional training should be provided in certain areas.
Becoming familiar with these 5 key maintenance failure metrics, and utilizing them as KPI's for your current maintenance program, can help you to cut costs, mitigate downtime, and streamline your operations for maximum productivity.
Effectively managing preventative maintenance can be a labor-intensive task, with many moving parts. However, there are resources available to help you improve and/or streamline your workflow with regards to scheduling, data collection and analysis, and so forth. One such resource is preventive maintenance software.
Ready to learn more about best practices for equipment maintenance?
You can find more resources here.


